 In the year since fifth edition came out, I’ve spent an inordinate amount of time deconstructing its monsters and putting them back together again. The lessons I’ve learned have been invaluable when developing new creatures for third-party monster collections such as Fifth Edition Foes from Necromancer Games and Southlands Bestiary and Tome of Beasts from Kobold Press. These lessons would be equally useful to everyone who wants to create their own monsters, either for their home games or for publication. In this Howling Tower series, I’ll share those lessons and some of the analysis behind them.
Yes, that means these articles will look at numbers, but I’ll be the one doing the math. You, the reader, shouldn’t need to worry about standard deviation or the difference between the mean and the mode. As much as possible, I’ll hide the math in graphs, so you can see how the numbers behave without needing to actually touch them.
(That said, if you’re serious about designing monsters or any other aspects of games, you owe it to yourself to take a basic course on statistics or read a recent book on the subject. A monster’s story is only half the picture; numbers are the other half, and getting the numbers right is important.)
The first person to tackle this subject seriously (that I’m aware) of was the blogger Surf Archer. If you haven’t read his excellent series, I recommend it highly. His articles are longer and more exhaustive than mine, but he had access to only a limited selection of fifth edition monsters for much of his work.
A note on methodology. For anyone who wonders how I did this, it’s simple. I sat down with a copy of the Monster Manual, and I typed all the numbers into a spreadsheet. Then I tore into that spreadsheet with graphs and pivot tables until I’d teased out its secrets. You can do the same if you have a few days to spare and you enjoy cracking into numbers. See the note above about statistics.
Part 1: Ability Scores
Of all the numbers in the Monster Manual and other monster books, ability scores are the most straightforward. That’s because fifth edition steps away from other recent editions and returns to the philosophy that monster ability scores (and PC and NPC ability scores, too) should arise not from any artificial need for the monster to get ever-increasing bonuses on its attack rolls but organically from the monster’s real-world* capability. (*You know what I mean.) The ever-increasing bonuses are provided by the proficiency bonus, which depends solely on the tier of play where the monster is most at home. That simple tool lets monster designers assign Strength, Dexterity, Wisdom, and other scores based on how strong, dexterous, and wise the monster should be, compared to a standard human, instead of on how much of a bonus they want added to its dice rolls.
That doesn’t mean monster ability scores don’t increase as monsters get tougher; they do, in a fairly predictable manner, as we’ll see below. It does mean that the #1 rule for assigning ability scores to monsters is this:
When assigning ability scores to monsters, look at similar monsters and choose similar numbers.
How does that work? If you’re designing a monster that you think should be stronger than an orc (Str 16) but weaker than an ogre (Str 19), then give it Strength 17 or 18. It’s that simple.
It’s important to bookend your notion with both a minimum and a maximum. In developing monsters, I’ve seen many where the designer wrote something like “this mutant drow is smarter than most normal drow,” and then made it smarter than most mind flayers. This is especially important to watch out for when converting older OGL monsters for use with fifth edition. Ability scores look similar between the two systems, but they aren’t really comparable. If you just copy the old numbers across to the new stat block, you’ll get ability scores that are increasingly inflated as CRs rise.
So which numbers are right?
Although fifth edition ability scores are assigned on a scale from 1 to 30, only eight numbers really matter: the even numbers from 10 to 20, everything less than 10, and everything higher than 21. In the Monster Manual, 80 percent of all ability scores land in the range 10–20. Everything outside that range could be changed to “this ability doesn’t matter” and “everything the monster does with this ability succeeds,” and very little would change in the game. Only even numbers matter because those are where the ability modifiers change; 10 and 11, for example, are functionally identical.
(Click on each chart below to see a larger version of it.)
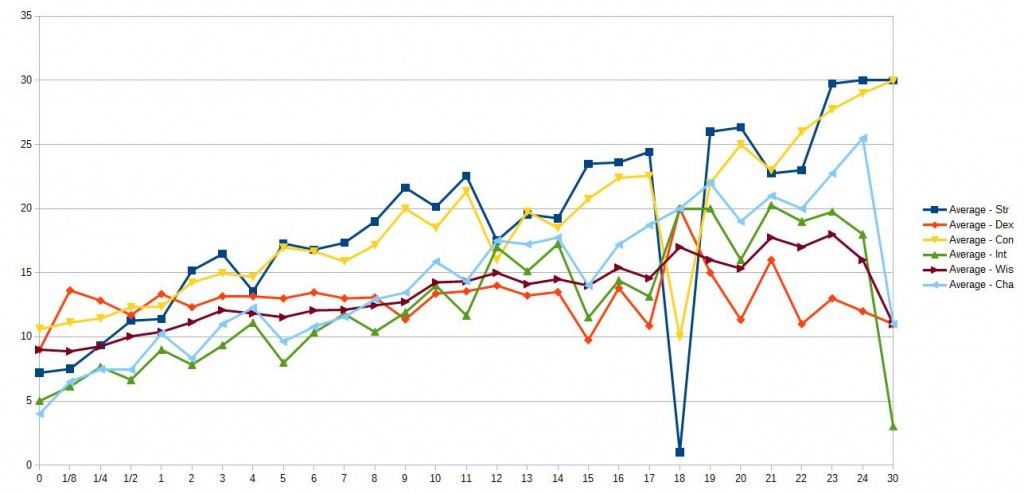
Chart 1 plots average ability scores by challenge rating. It shows that the averages do increase as CR increases, but not nearly as fast as CR and not all at the same rate. If these irregular plots are straightened into lines (called trend lines), they yield the following formulas:
Strength ≅ (CR x 0.7) + 9; +/– 6
Dexterity ≅ 12.5; +/– 3.5
Constitution ≅ (CR x 0.6) + 10; +/– 5
Intelligence ≅ (CR x 0.6) + 5; +/– 5
Wisdom ≅ (CR x 0.3) + 9; +/– 3
Charisma ≅ (CR x 0.6) + 5; +/– 5
These are rounded approximations. In general, you can adjust these targets up or down by the number listed after “+/–” and still be inside the standard deviation* established by the Monster Manual. The further you move from the average, the more of an exception your monster becomes.
(*OK, I know I sort of promised not to use terms like standard deviation, but in this case, it’s too useful and too important to ignore. All it means is that two-thirds of the ability scores in the Monster Manual fall within that range. For example, two-thirds of all monsters’ Wisdom scores fall within 3 points of [CR x 0.3] + 9. If you stick within those ranges, your monster will be “as average as” two-thirds of all the official monsters. Move outside those ranges and you’re entering the land of exceptional beings.)
Dexterity alone has no significant correlation to CR. This can be seen on the chart, where the orange line is basically level along its entire length. It jumps around more as CR increases, but the trend line has no appreciable slope.
In fact, all of the plots become more variable as CR increases. This is because there are many fewer monsters at high CRs than at low ones. A single extreme value among the few high-CR monsters causes the average to swing more violently than it does at low CRs. This is most obvious in the enormous dip on the Strength line at CR 18. The only CR 18 monster in the MM is the demilich which, being nothing but a floating skull, has a notable lack of muscles. Significant outliers like that were factored out of the formulas listed above.
Size and Type
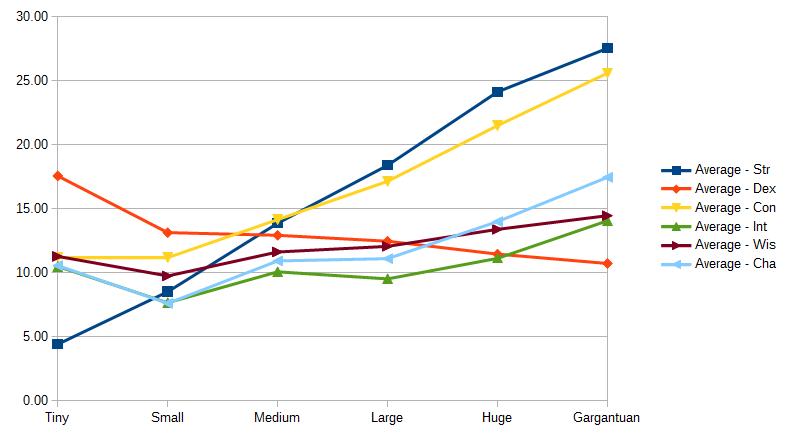
Challenge rating isn’t the only interesting way to look at ability scores. Size and creature type matter, too. Chart 2 shows how the six ability scores vary according to creature size. Each plot represents one ability score; data points along the plot are the average score in that ability for the six size categories from tiny to gargantuan. The most important lessons from this chart are fairly obvious: Strength and Constitution increase with size, Dexterity decreases, and Intelligence, Wisdom, and Charisma are largely unaffected.
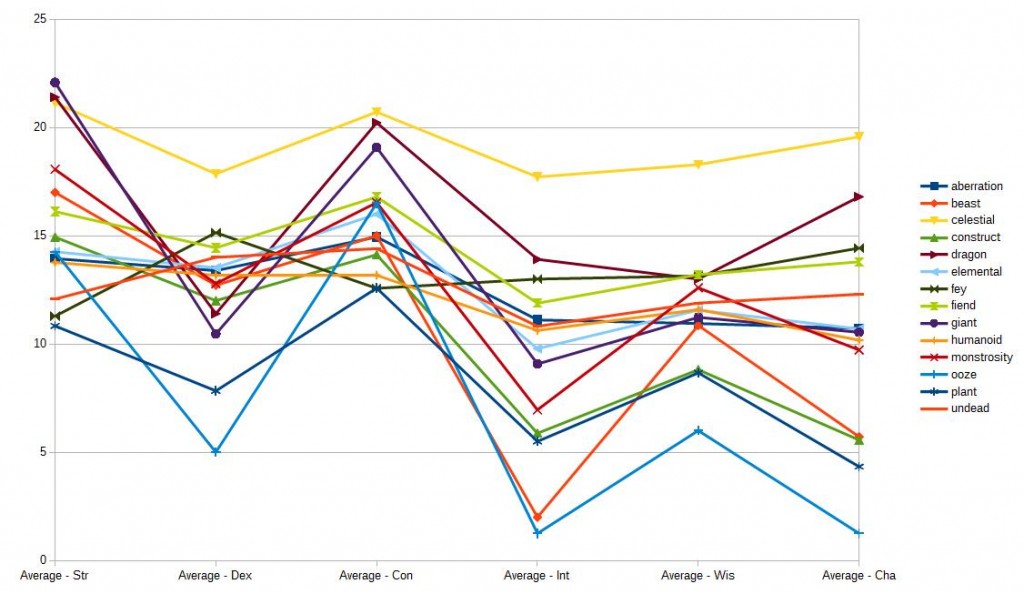
Chart 3 is very busy, but with a little bit of examination, you should be able to extract some useful nuggets from it. Each plot represents a type of creature: beast, construct, elemental, giant, and so on. Data points on the plot show average values for each of the six ability scores among that type of creature. The chart shows, for example, that celestials have the highest average ability scores of any creature type; that oozes have the highest variability between their physical and mental abilities; and that humanoids, undead, and aberrations have the least variability in their averages. Many more nuggets can be extracted from it, but I leave that as an exercise for you.
Next Time: Hit Dice and hit points.
The Tome of Beasts Kickstarter is underway and provides 300 new monsters for 5th Edition. Join us!

How is this analysis and presentation free? Invaluable. Thank you.
I really appreciate the graphing and plotting and analysis you’ve done. Its a great start, along with Surf’s posts, about how to design a monster. Perhaps if you made an example monster, explaining each step along the way as you follow these guidelines you’re making, that would help make it more clear.
One thing that appeared to be a typo: “In fact, all of the plots become more variable as CR increases. This is because there are many fewer monsters at high CRs than at low ones.”
Perhaps you meant ‘way fewer monsters’ than ‘many fewer’ because that just seems…. an oxymoron, for lack of better words.
What I really meant was “fewer monsters,” but I have a fetish for the word many.
Great breakout of the numbers for these beasties. You are absolutely right when it comes to knowing the math if you really want to know the monsters. I spent years doing stuff just like this for fun. Eventually turned the number crunching into my own game, https://fyxtrpg.com/ . Deep diving into the numbers of 3.5 and 4e really got me thinking of optimizations and ways to streamline character stats. Then the experiment turned into something playable.
I love how you broke out the ability scores per level. Using those you really could plot out just about anything you wanted to quite easily. Though you run into the issues of monsters feeling like repeats. Plus, a lot of their stats don’t really matter as monsters as much as they do with PCs.
Oh and I like the last one as well. I think it speaks to what the designers like more versus what they might actually want to be “more powerful”. Though I guess arguments could be made for both.
Keep up the crunching!
Fascinating information. Thank you for sharing and for taking the time to build these helpful formulas and graphs.